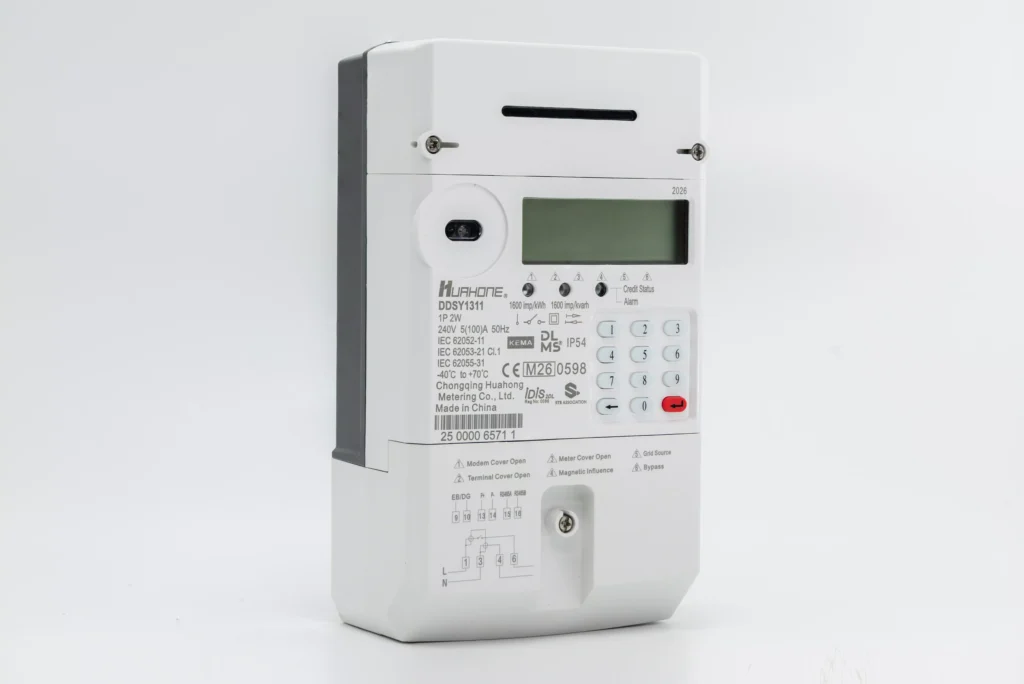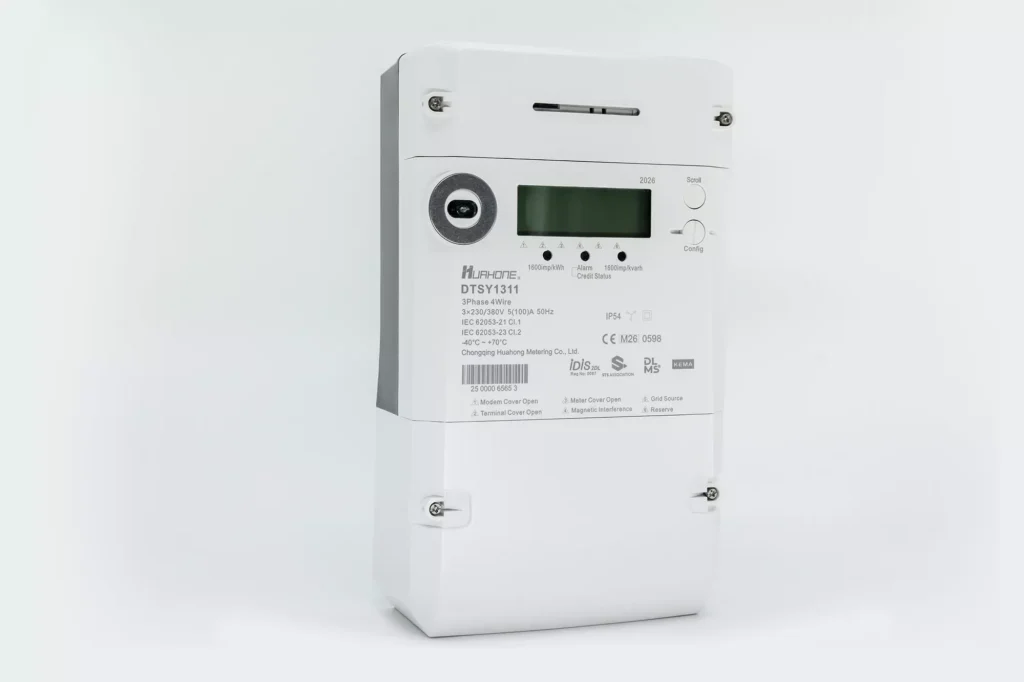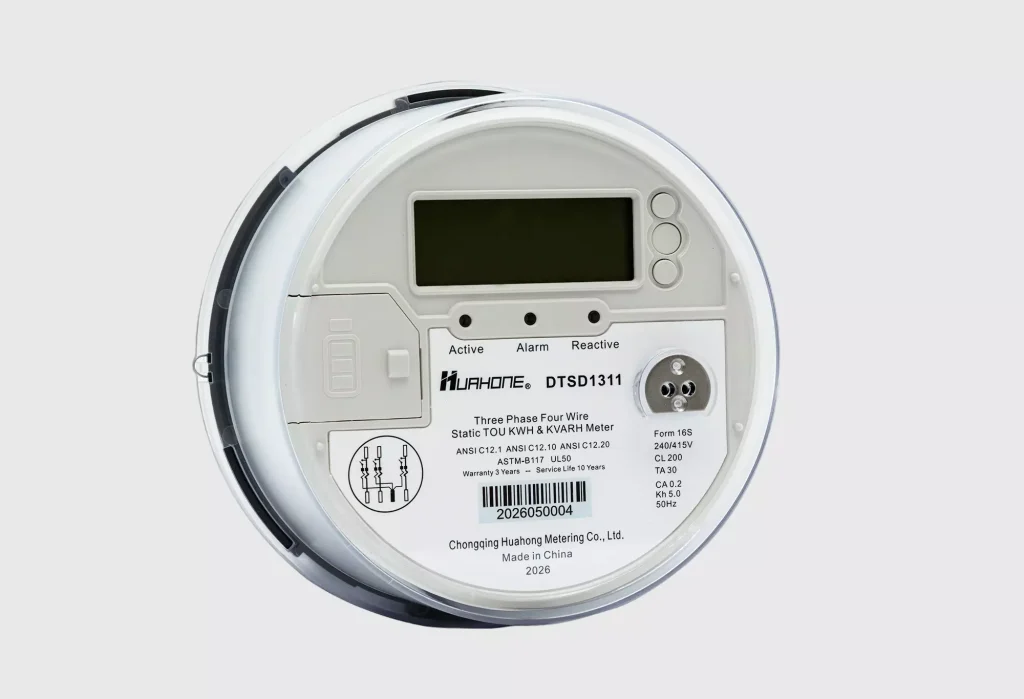
Three Phase Four Wire Socket Type (16S) Static TOU Meters
Type: DTSD1311
MOQ: 100 pieces
The DTSD1311 Three Phase Four Wire Socket Type Static TOU Meters are designed for commercial & industrial electricity metering. The meters support active and reactive energy metering and billing, TOU, maximum demand, load profile and event logs. By providing highly accurate and reliable performances, the meters are ideal devices for various applications such as revenue metering, load analyzing, and power quality monitoring.
description
Introduction
The DTSD1311 meters are developed based on ANSI standards and are UL type approved for outdoor installation. There are two forms available, 16S for direct connection application with accuracy up to Class 0.2. The meters are suitable for measurement of different electrical parameters as per the energy and power demand requirement in an AC balanced/unbalanced system over a power factor range of zero lag to unity to zero lead.
This document is mainly prepared for the installation, operation and maintenance of DTSD1311 Three Phase Four Wire Socket Type Static TOU Meters. It provides technical reference for people using the meters.
Reference standards
| Standard | Description |
| ANSIC12.1 | American National Standard For Electric Meters -Code for Electricity Meters |
| ANSIC12.10 | American National Standard For Physical Aspects of Watt-hour Meter Safety Standard |
| ANSI C12.20 | American National Standard For Electricity Meters- 0.2 and 0.5 Accuracy Classes |
| ANSIC12.16 | American National Standard For Electricity Metering- Solid state Electricity Meters |
| ANSI C62.41 | Voltage AC power circuit and AC circuits |
| ANSI C37.90.1 | IEEE Surge Protection |
| ANSI C12.18 ANSI C12.19 | Protocol for optical port |
| ASTM -B117 | Salt spray (fog) testing apparatus |
| UL-50 | Safety enclosure for electrical equipment |
Drawings
Drawings
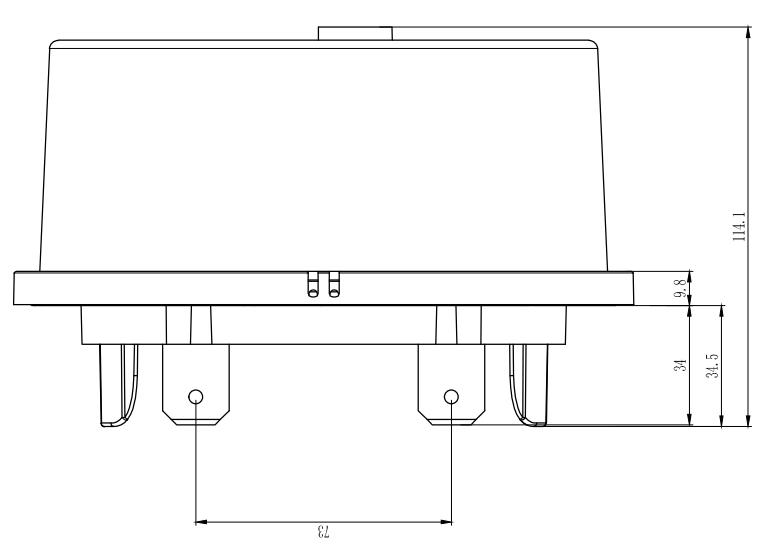
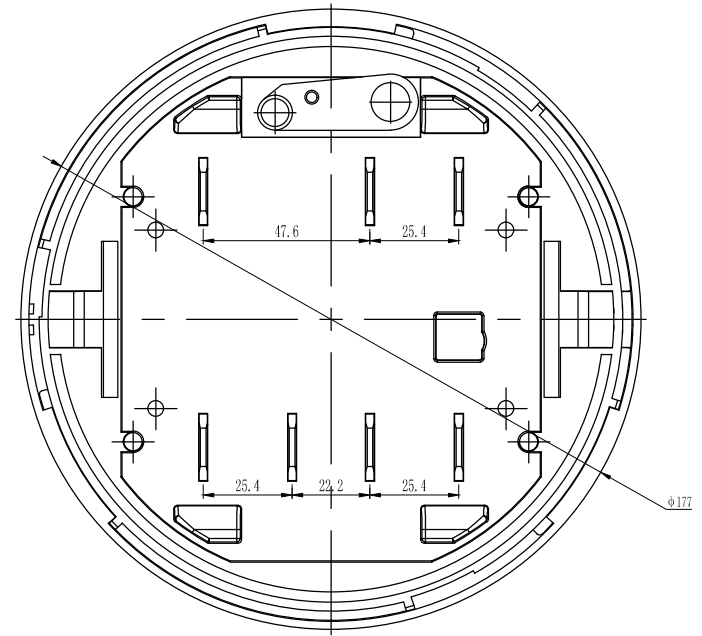
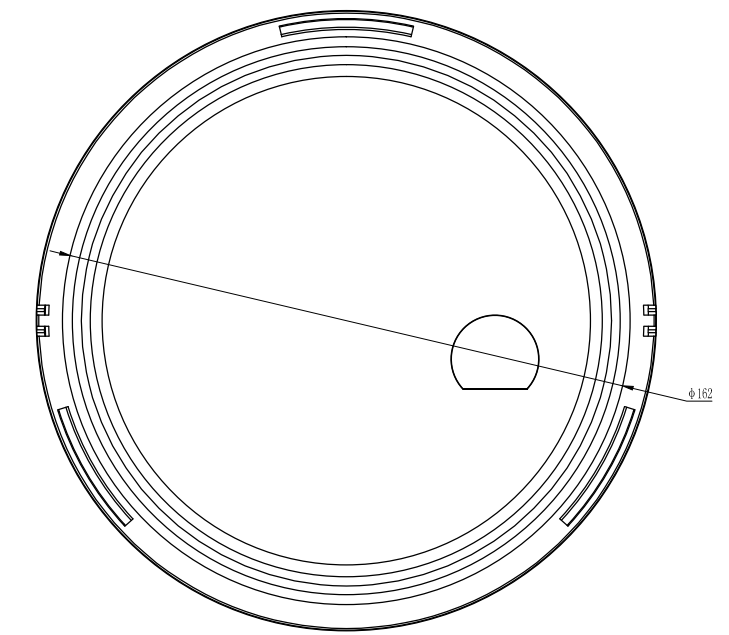
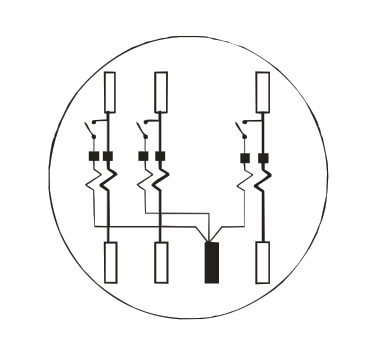
Connection Diagrams
Nameplates
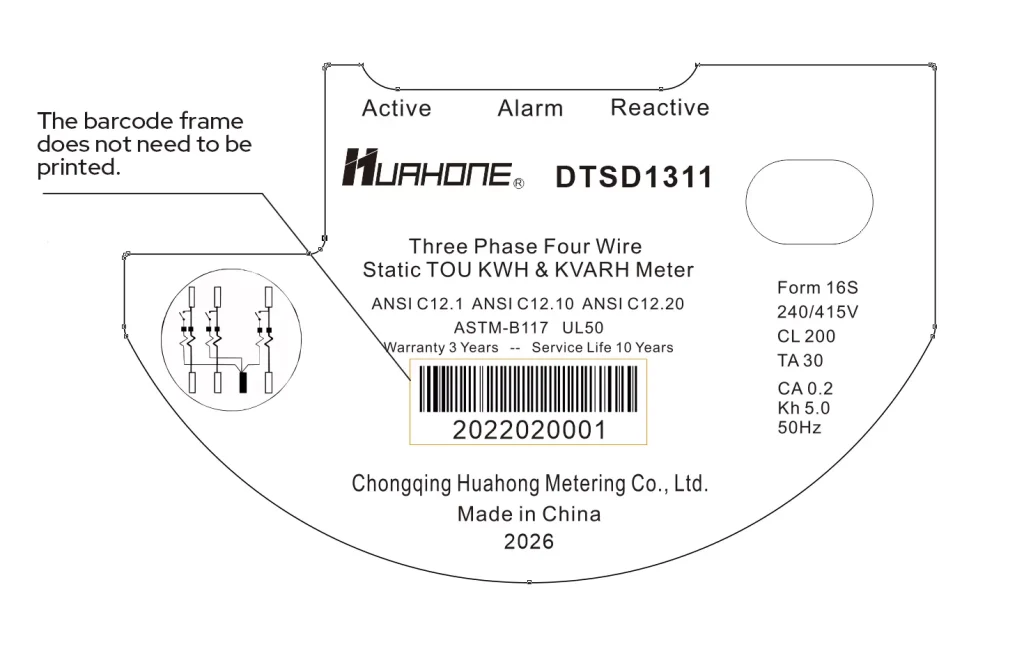
Specifications and Functions
| Category | Item | Parameter |
| Basic | Meter type | Fully static, three phase four wire, three element |
| Base & Form | Socket based, Form 16S | |
| Current | [16S]30A(200A)/15(100A) | |
| Starting current | [16S]0.1A/0.05A | |
| Constant | [16S]KH 5.0/2.5 | |
| Power consumption | [16S] Voltage circuit ≤ 1W/1VA; Current circuit ≤ 1VA | |
| Accuracy | Active 0.2, Reactive 1 | |
| Voltage | 240/415V (-30 % ~ +15%) | |
| Frequency | 50HZ±5% | |
| Accuracy checking | LED test output | |
| Working environment | Working temperature | -40°C to +85°C |
| Relative humidity | ≤100% (non-condensing) | |
| Working altitude | Up to 4000 meters | |
| Installation | For both indoor and outdoor with rain/dust/moisture/salt spray proof. | |
| Communication | Optical port | A two way optical port for programming and reading purposes is provided. Protocol: ANSI C12.18/ANSI C12.19 |
| Energy | Active energy | kWh (import + export) of total and each rate |
| Reactive energy (leading) | kVarh Quadrant 1 and 3 of total and each rate | |
| Reactive energy (lagging) | kVarh Quadrant 2 and 4 of total and each rate | |
| Demand | Demand objects | Active maximum demand Active cumulative demand Instantaneous active demand Date of Maximum Demand Time of Maximum Demand |
| Demand period | Configurable, default 30 mins | |
| Demand reset | 1. By communication command 2. Auto reset at the time of billing | |
| Billing | Billing time & day | Configurable, default 00:00 on the first day of each month. |
| Billing objects | Total kWh Leading kVarh Lagging kVarh Active MD and time of occurrence Active cumulative demand | |
| Historical data | 40 historical data including Previous month cumulative kWh of total and each tariff Previous month cumulative kVarh leading of total and each tariff Previous month cumulative kVarh lagging of total and each tariff Previous month maximum demand, previous month maximum demand date and time. | |
| Instantaneous value | Voltage | Phase A/B/C with Angle |
| Current | Phase A/B/C with Angle | |
| Power factor | Total/A/B/C | |
| Active power | Total/A/B/C | |
| Reactive power | Total/A/B/C | |
| RTC | Accuracy | ≤0.5s/day (in 23°C) |
| Synchronization | By communication command | |
| TOU | Rates | Support up to 4 rates. Rate period can be configured. |
| Events | Event log | 300 events |
| Main events | Power off/on, time change, demand reset, rate change, measurement error, low battery, reverse currentRecord total number of outages | |
| Load profile | Channels and objects | Totally 7 channels to store profile date including KWH (Rate-A & Rate- B), KVARH (Rate-A & Rate-B), Voltage, Current and Maximum demand at 30 minutes interval for previous 12 months. The profile data can be downloaded by PC software for analysis. |
| Display | Energy | [16S]7+0 |
| Cumulative demand | 4+2 | |
| Demand (Power) | 3+3 | |
| Voltage | 3+2 | |
| Current | 3+3 | |
| Power factor | 1+3 | |
| Display parameters | Full screen, time, date, total kWh, leading kVarh, lagging kVarh, previous month total kWh, previous month leading kVarh, previous month lagging kVarh, total active MD, cumulative active demand, previous month total active MD, previous month cumulative active demand, number of demand reset, present total demand, phase A/B/C voltage, phase A/B/C current, active power total/A/B/C, power factor total/A/B/C, number of outages | |
| Mode of display scroll | Auto scroll and manual scroll are available. Auto display mode shows all parameters in pre-defined automatic scroll within the specified time (configurable and default 10 seconds).Manual scroll is realized by magnet touch to display parameters same as auto scroll | |
| Integers and decimals | Configurable. Total 7 digits. | |
| Display off after auto scroll finishes | After displaying the last parameter of auto scroll, the LCD will be off for a preset period (maximum 15 seconds as per ANSI standard) and then be on again. | |
| Scroll lock | Scroll lock facility is available by PC software to lock the desired parameters. Lock time is configurable. | |
| Power off display | The meters are readable in power off condition supported by a battery back-up. LCD can be turned on to show scroll parameters by magnet touch and will be off in 5 minutes. | |
| Alarm | Alarm indication | Available by LED and LCD |
| Anti-tampering | Tamper & fraud monitoring features | Automatically identify the corrected service and verify the correct wiring. Operate and accurately register demand and energy when service voltage is applied from any one or two input terminals to neutral. Continue to operate when service voltage is applied to phase ABC without neutral. Keep working accurately irrespective of the phase sequence of the supply.Log energy in forward direction even if the current is flowing in reverse direction in one or more phases. External magnetic field DC Magnet will not affect the proper functioning and recording of energy as per error limits prescribed in the standard. |
| Self-diagnostic check | Indication for unsatisfactory / non-functioning / malfunctioning | Time and date on meter display All display segments on meter display Real Time Clock (RTC) status Non-volatile Memory (NVM) status Presence of all voltages on meter display While starting, the meters perform: – Check for phase voltages – Check for cross phasing – Check phase voltage and current polarity |
| Meter case and material | Meter base and cover | Made of unbreakable high grade fire resistant reinforced polycarbonate and UV/rain/dust/moisture/salt spray proof |
| Insulating material | Non-hygroscopic, nonageing and of tested quality. Metal parts are protected against corrosion. | |
| Seals | Two security seals are provided. The meter cover cannot be removed undamaged without breaking the seals. | |
| Meter tests | Type tests | ANSI C12.1, ANSI C12.20 including weather simulation test, UV resistance test and salt spray test |
| UL-50 | Rain and dust test as per UL-50 for type 3 enclosures | |
| Quality guarantee | Product quality | Using high quality materials and components with SMT production technology. |
| Service life | Minimum 10 years of satisfactory operation under normal electrical conditions. | |
| Warranty | 36 months from the date of receiving |
Display
LCD full screen
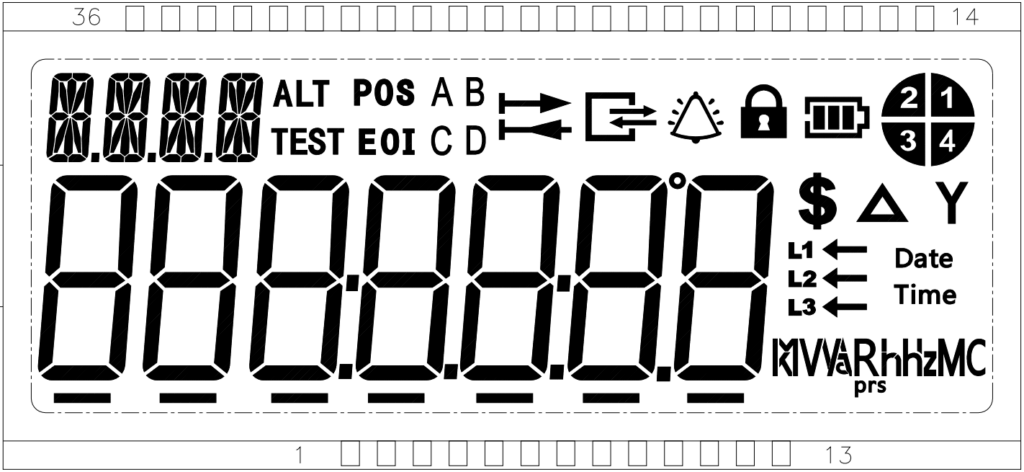
LCD icons
| Icons | Description |
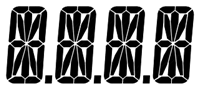 | Code of display parameters |
 | TEST – Test mode ALT – ALT mode EOI – End Of Interval for DEMAND (keeps on for total demand and flashes for TOU demand POS — Point Of Sale (optional) |
 | Rates A, B, C, D |
 | Remote communication status (optional) |
 | Local communication |
 | Alarm |
 | Password lock |
 | Flash when battery is low. |
 | Connection |
 | Quadrants |
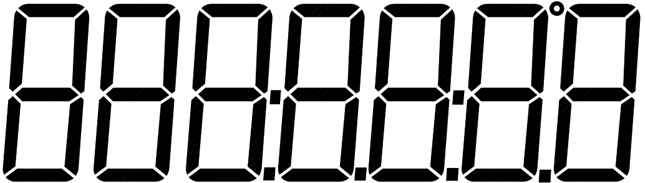 | Primary display for energy, voltage, current, demand, etc. |
 | Flash when voltage lossOff when phase loss |
 | Direction of reverse current |
 | Units of parameters |
 | Money (optional) |
 | Power: ■□□□□□ 10%*Un*Ib ■■□□□□ 50%*Un*Ib ■■■□□□ 100%*Un*Ib ■■■■□□ 200%*Un*Ib ■■■■■□ 400%*Un*Ib ■■■■■□ 600%*Un*Ib ■■■■■■ 1000%*Un*Ib |
Quantities measured and displayed
The meters measure and display the following electrical quantities.
| No. | Name of Parameters | Code | Symbol | Format |
| Full screen/segment check | / | / | / | |
| Date | DATE | / | DD:MM:YY | |
| Time | TIME | / | HR:M:S | |
| Cumulative, Total KWH | P.S.T.T | kWh | XXXX.XX | |
| Cumulative, Rate-A KWH | P.S.T.A | kWh | XXXX.XX | |
| Cumulative, Rate-B KWH | P.S.T.B | kWh | XXXX.XX | |
| Cumulative, Total KVARH (Leading) | Q.R.T.T | kVARh | XXXX.XX | |
| Cumulative, Rate-A KVARH (Leading) | Q.R.T.A | kVARh | XXXX.XX | |
| Cumulative, Rate-B KVARH (Leading) | Q.R.T.B | kVARh | XXXX.XX | |
| Cumulative, Total KVARH (Lagging) | Q.F.T.T | kVARr | XXXX.XX | |
| Cumulative, Rate-A KVARH (Lagging) | Q.F.T.A | kVARr | XXXX.XX | |
| Cumulative, Rate-B KVARH (Lagging) | Q.F.T.B | kVARr | XXXX.XX | |
| Instantaneous Demand | KW T | KW | XXX.XXX | |
| Instantaneous Voltage Phase A | VR | V | XXX.XX | |
| Angle Phase A | PH.AA | / | XX | |
| Instantaneous Voltage Phase B | VY | V | XXX.XX | |
| Angle Phase B | PH.AB | / | XX | |
| Instantaneous Voltage Phase C | VB | V | XXX.XX | |
| Angle Phase C | PH.AC | / | XX | |
| Instantaneous Current Phase A | I R | A | XXX. XXX | |
| Angle Phase A | PH.IA | / | XX | |
| Instantaneous Current Phase B | I Y | A | XXX. XXX | |
| Angle Phase B | PH.IB | / | XX | |
| Instantaneous Current Phase C | I B | A | XXX. XXX | |
| Angle Phase C | PH.IC | / | XX | |
| Instantaneous Power Factor | PF | PF | X.XXX | |
| Maximum Demand | C.T.M1 | KWM | XXX. XXX | |
| Cumulative Maximum Demand | C.T.C1 | KWC | XXXX.XX | |
| Date of Maximum Demand | C.T.D1 | Date | DD:MM:YY | |
| Time of Maximum Demand | C.T.T1 | Time | HR:M:S | |
| Maximum Demand reset times | C.N.ST | / | XXXXXX | |
| Previous month Cumulative Total KWH | L.T.S0 | kWh | XXXX.XX | |
| Previous month Cumulative Rate-A KWH | L.A.S0 | kWh | XXXX.XX | |
| Previous month Cumulative Rate-B KWH | L.B.S0 | kWh | XXXX.XX | |
| Previous month Cumulative Total KVARH (Leading) | L.T.S4 | kVARh | XXXX.XX | |
| Previous month Cumulative Rate-A KVARH (Leading) | L.A.S4 | kVARh | XXXX.XX | |
| Previous month Cumulative Rate-B KVARH (Leading) | L.B.S4 | kVARh | XXXX.XX | |
| Previous month Cumulative Total KVARH (Lagging) | L.T.S5 | kVARr | XXXX.XX | |
| Previous month Cumulative Rate-A KVARH (Lagging) | L.A.S5 | kVARr | XXXX.XX | |
| Previous month Cumulative Rate-B KVARH (Lagging) | L.B.S5 | kVARr | XXXX.XX | |
| Previous month Maximum Demand | L.T.M1 | KWM | XXX.XXX | |
| Date of Previous month Maximum Demand | L.T.D1 | Date | DD:MM:YY | |
| Time of Previous month Maximum Demand | L.T.T1 | Time | HR:M:S | |
| Total Number of Outages | out | out | XXXXXX |
Display modes
a. Auto scroll. Auto display mode shows all parameters in pre-defined automatic scroll within the specified time (configurable and default 10 seconds). After displaying the last parameter of auto scroll, the LCD will be off for a preset period (maximum 15 seconds as per ANSI standard) and then be on again.
b. Manual scroll. Manual scroll is realized by magnet touch. Put the magnet on the meter LCD window for about 5 seconds, the meter will enter manual scroll mode and start display from the first screen. Under this mode when keeping the magnet on the meter, the LCD will scroll very quickly. When it scrolls to the parameter that you would like to check longer, just remove the magnet and then the parameter will show the normal display period (10 seconds as default defined). When the magnet is removed, the LCD will show the remaining parameters at 10 seconds interval until all parameters are finished and then the meter will exit the manual mode and be back to the auto mode.
c. Power off scroll. When there is no AC power supply, the LCD can be turned on to show parameters by magnet touch. Put the magnet each time to scroll to the next parameter. If there is no magnet action, the LCD will be off in 5 minutes.
Display parameters are same for all the modes.